![]()
Overview
KOI is a versatile and comprehensive tool for analyzing and benchmarking stocks and investment portfolios, with a specific focus on thematic sectors like on climate tech. It leverages Yahoo Finance data and supports all major stock exchanges and currencies.
Origins
I’ve always found it difficult to efficiently screen the market for new companies worth investing in. My process usually involves reading articles, listening to podcasts, watching YouTube videos, and jotting down names of interesting companies. Then I dig deeper—reading financial reports, analyzing company fundamentals, and assessing the return/risk profile. But it’s a very manual, time-consuming process.
I felt something was missing—a tool that could quickly surface companies based on their past shareholder returns. I didn’t have the budget or interest in getting a Bloomberg Terminal or subscribing to expensive data services. So I started wondering if I could build something myself using public data and Python.
That simple idea turned into six months of coding and eventually became KOI. My Python skills were rusty, but the project turned into a deeply rewarding learning experience—both technically and from a financial analysis perspective . It was also my first SW porject developped with the help of AI.
Over time, what started as a small side project grew into a fairly advanced library , offering features rarely accessible to retail investors. What began as a basic tool for analyzing a single stock evolved into a robust engine capable of benchmarking complex portfolios with stocks across multiple exchanges.
Key Features
- Global stock & currency support via Yahoo Finance
- Flexible currency reference (USD or EUR)
- Multiple weighting options for portfolio (equal, custom, random)
- Total return calculations at stock and portfolio level (capital gains + dividends)
- Automatic benchmarking against major indexes
- Annualized return and risk-adjusted metrics
- Sharpe Ratio and RSI calculation
Note: KOI analyzes static portfolios and does not track real-time changes or transactions over time.
Examples
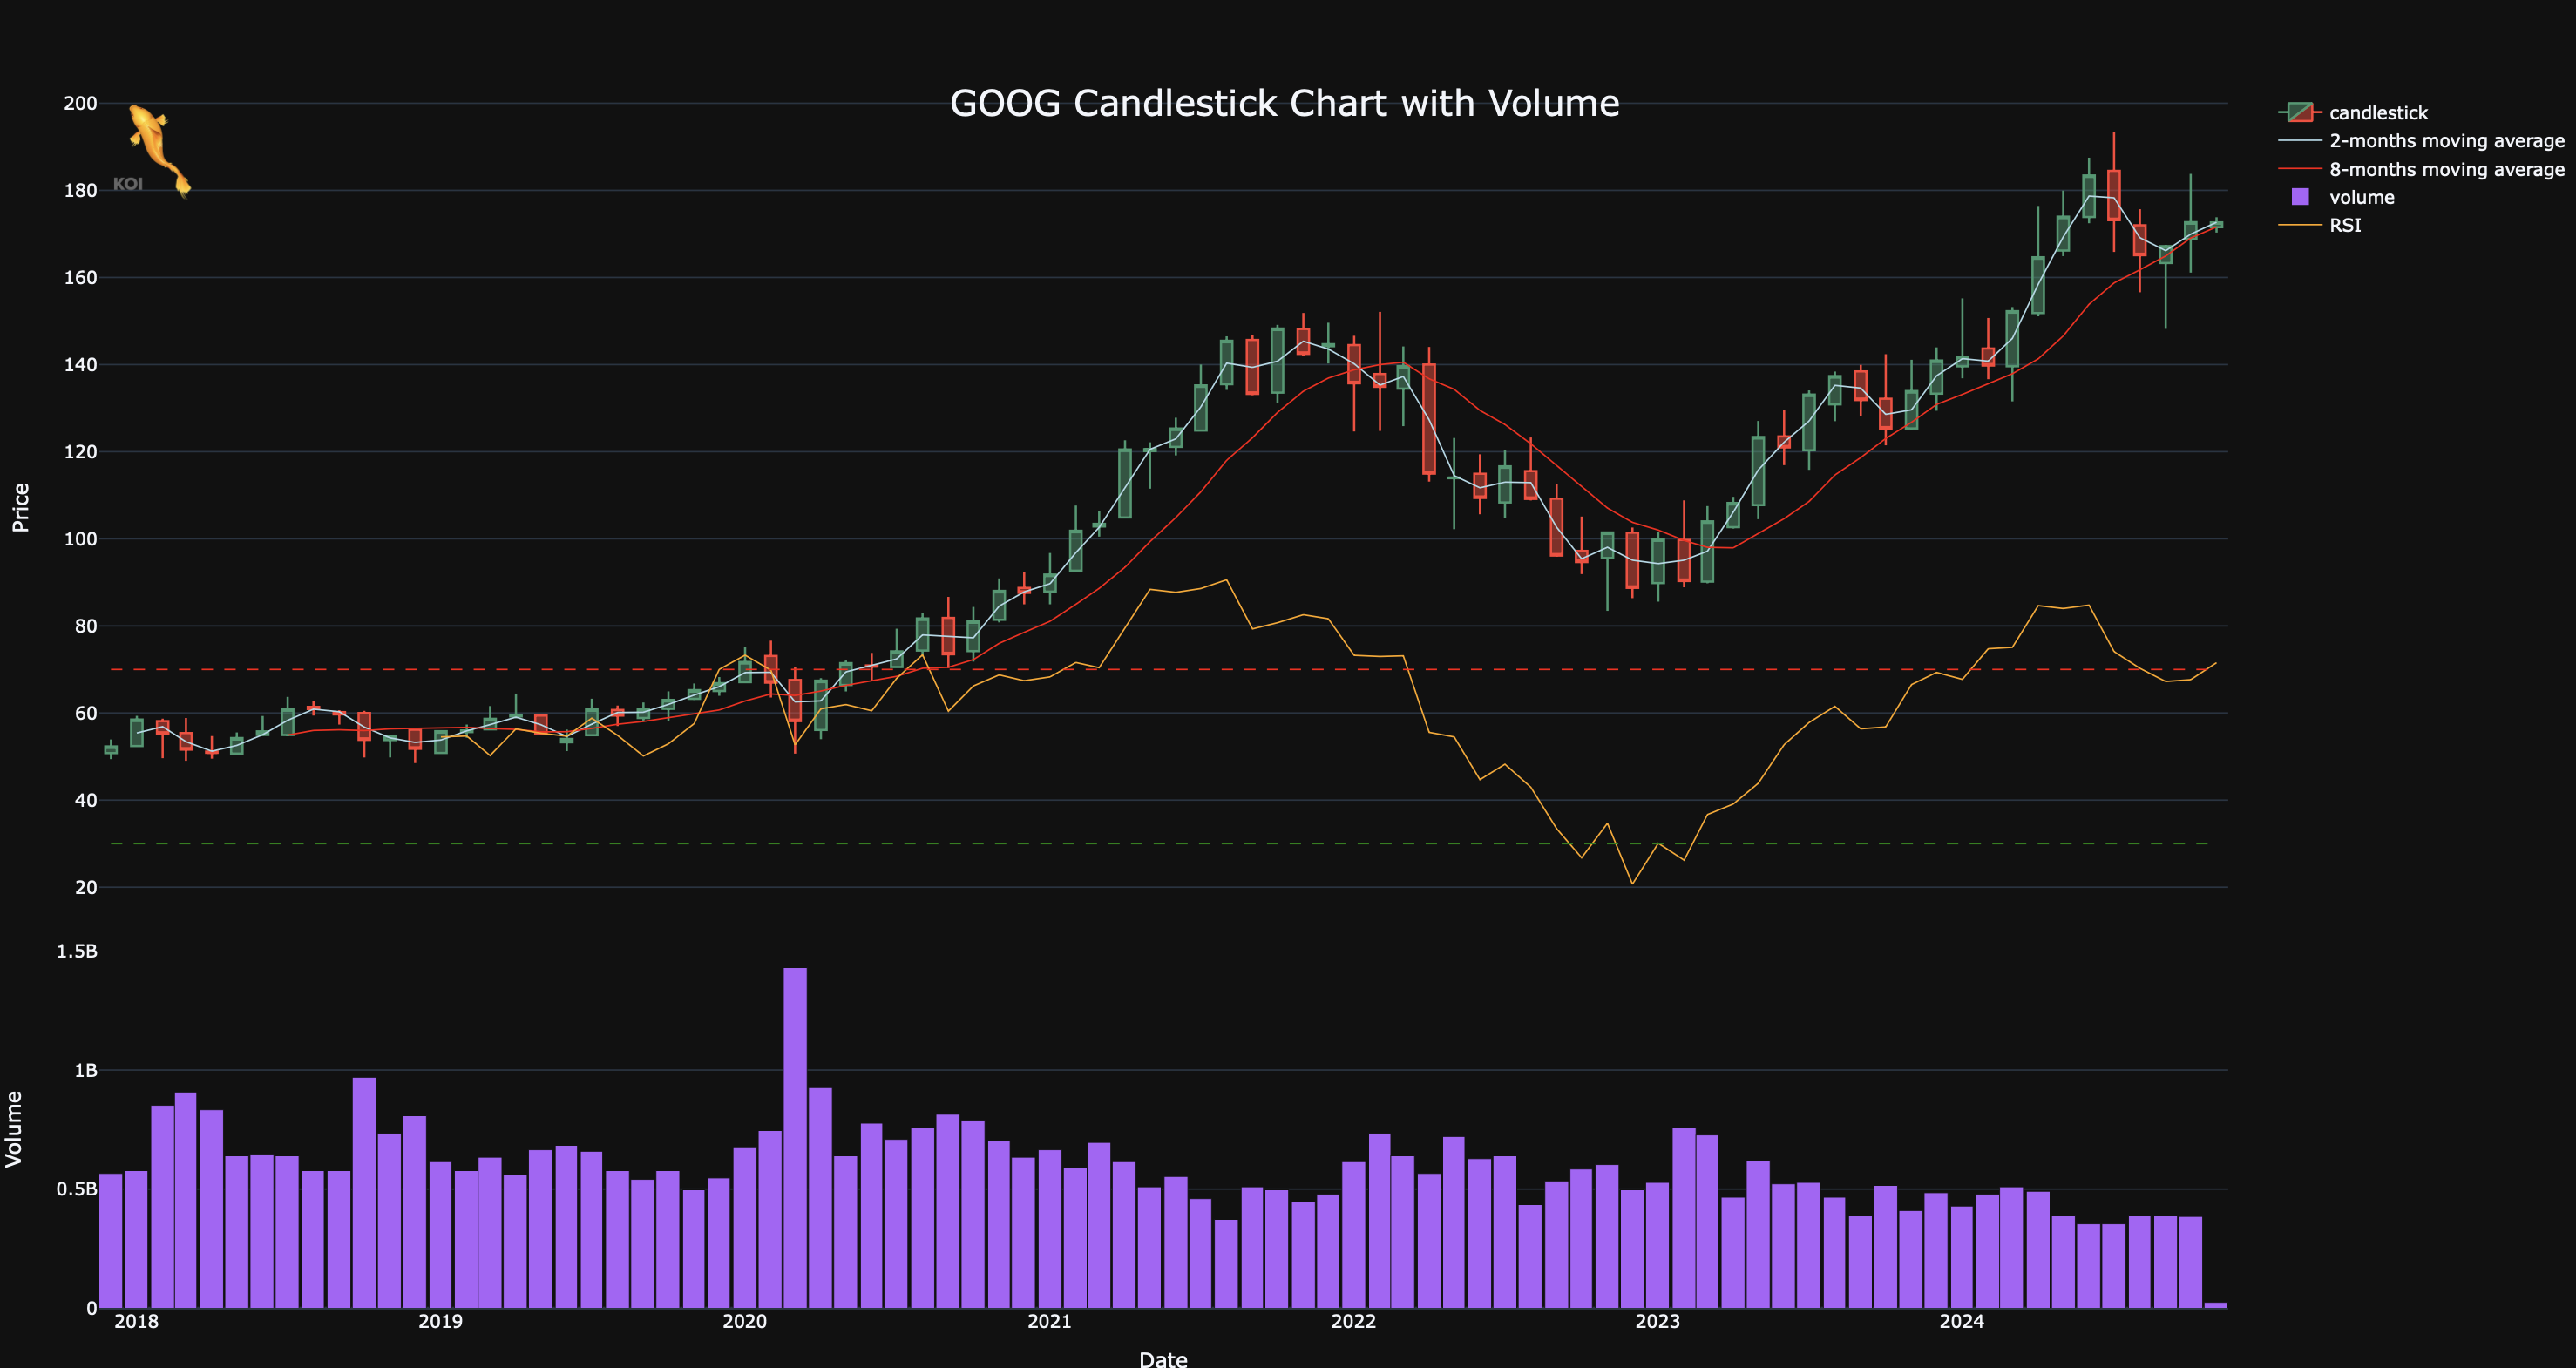
Single Stock Analysis – Google
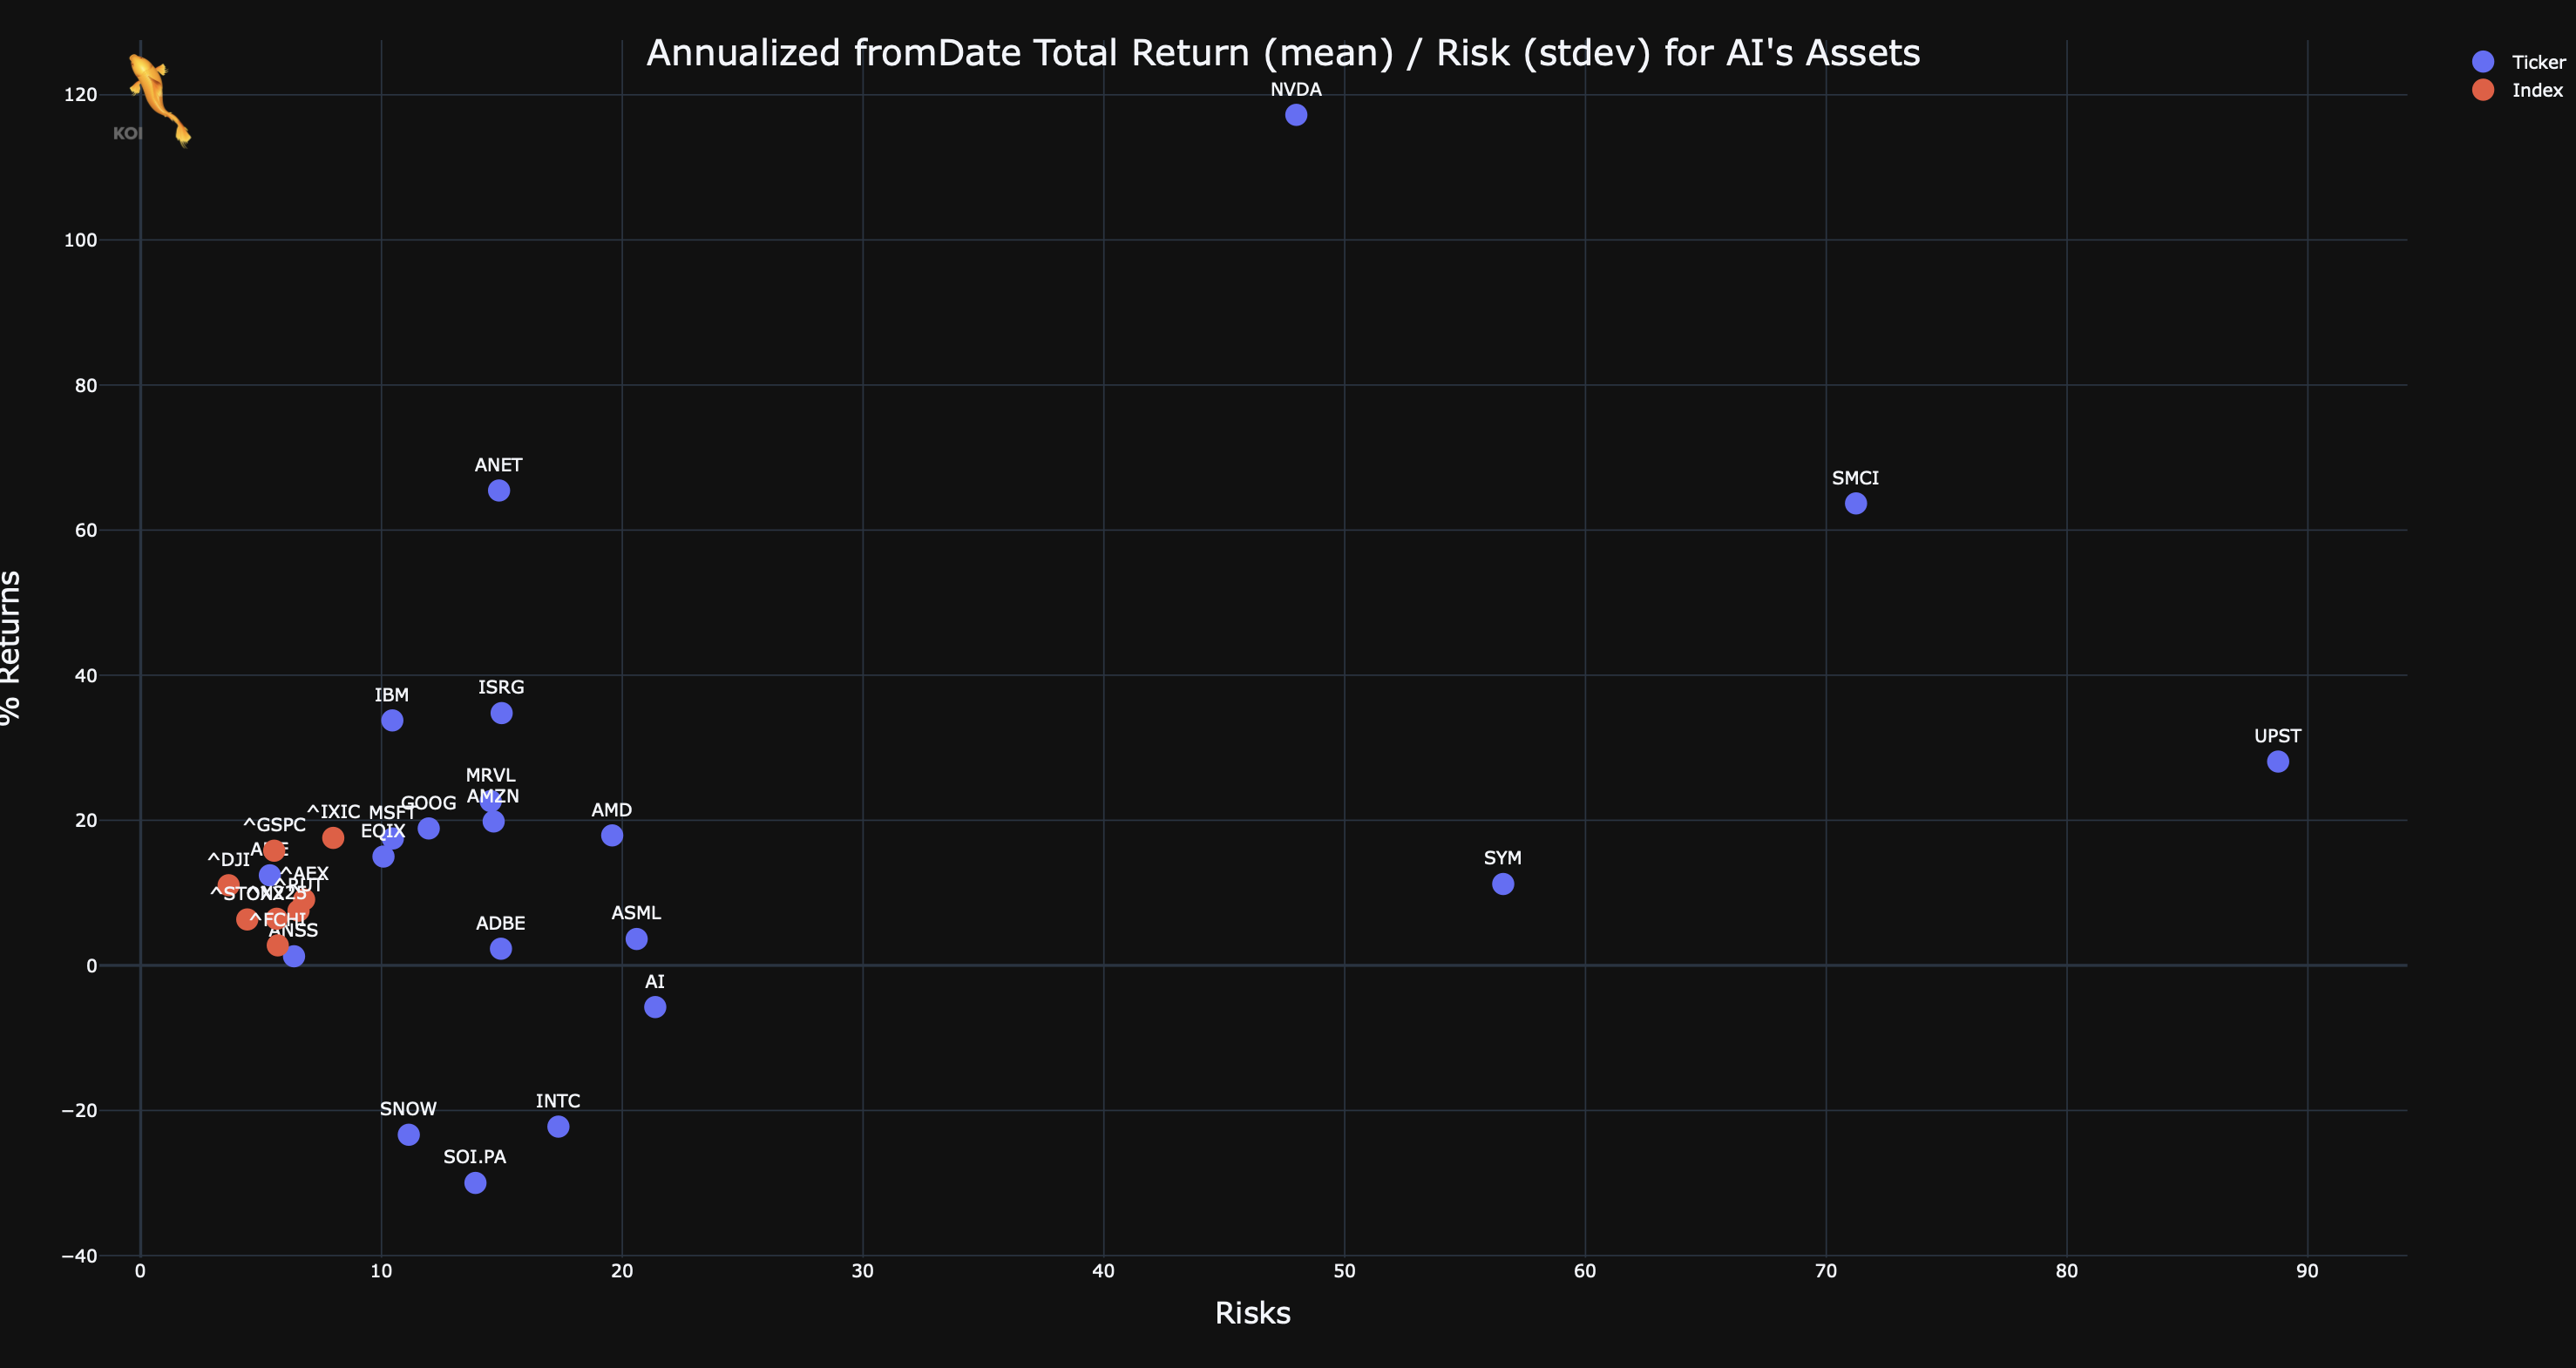
Annualized returns vs risks profile Artificial Intelligence tickers
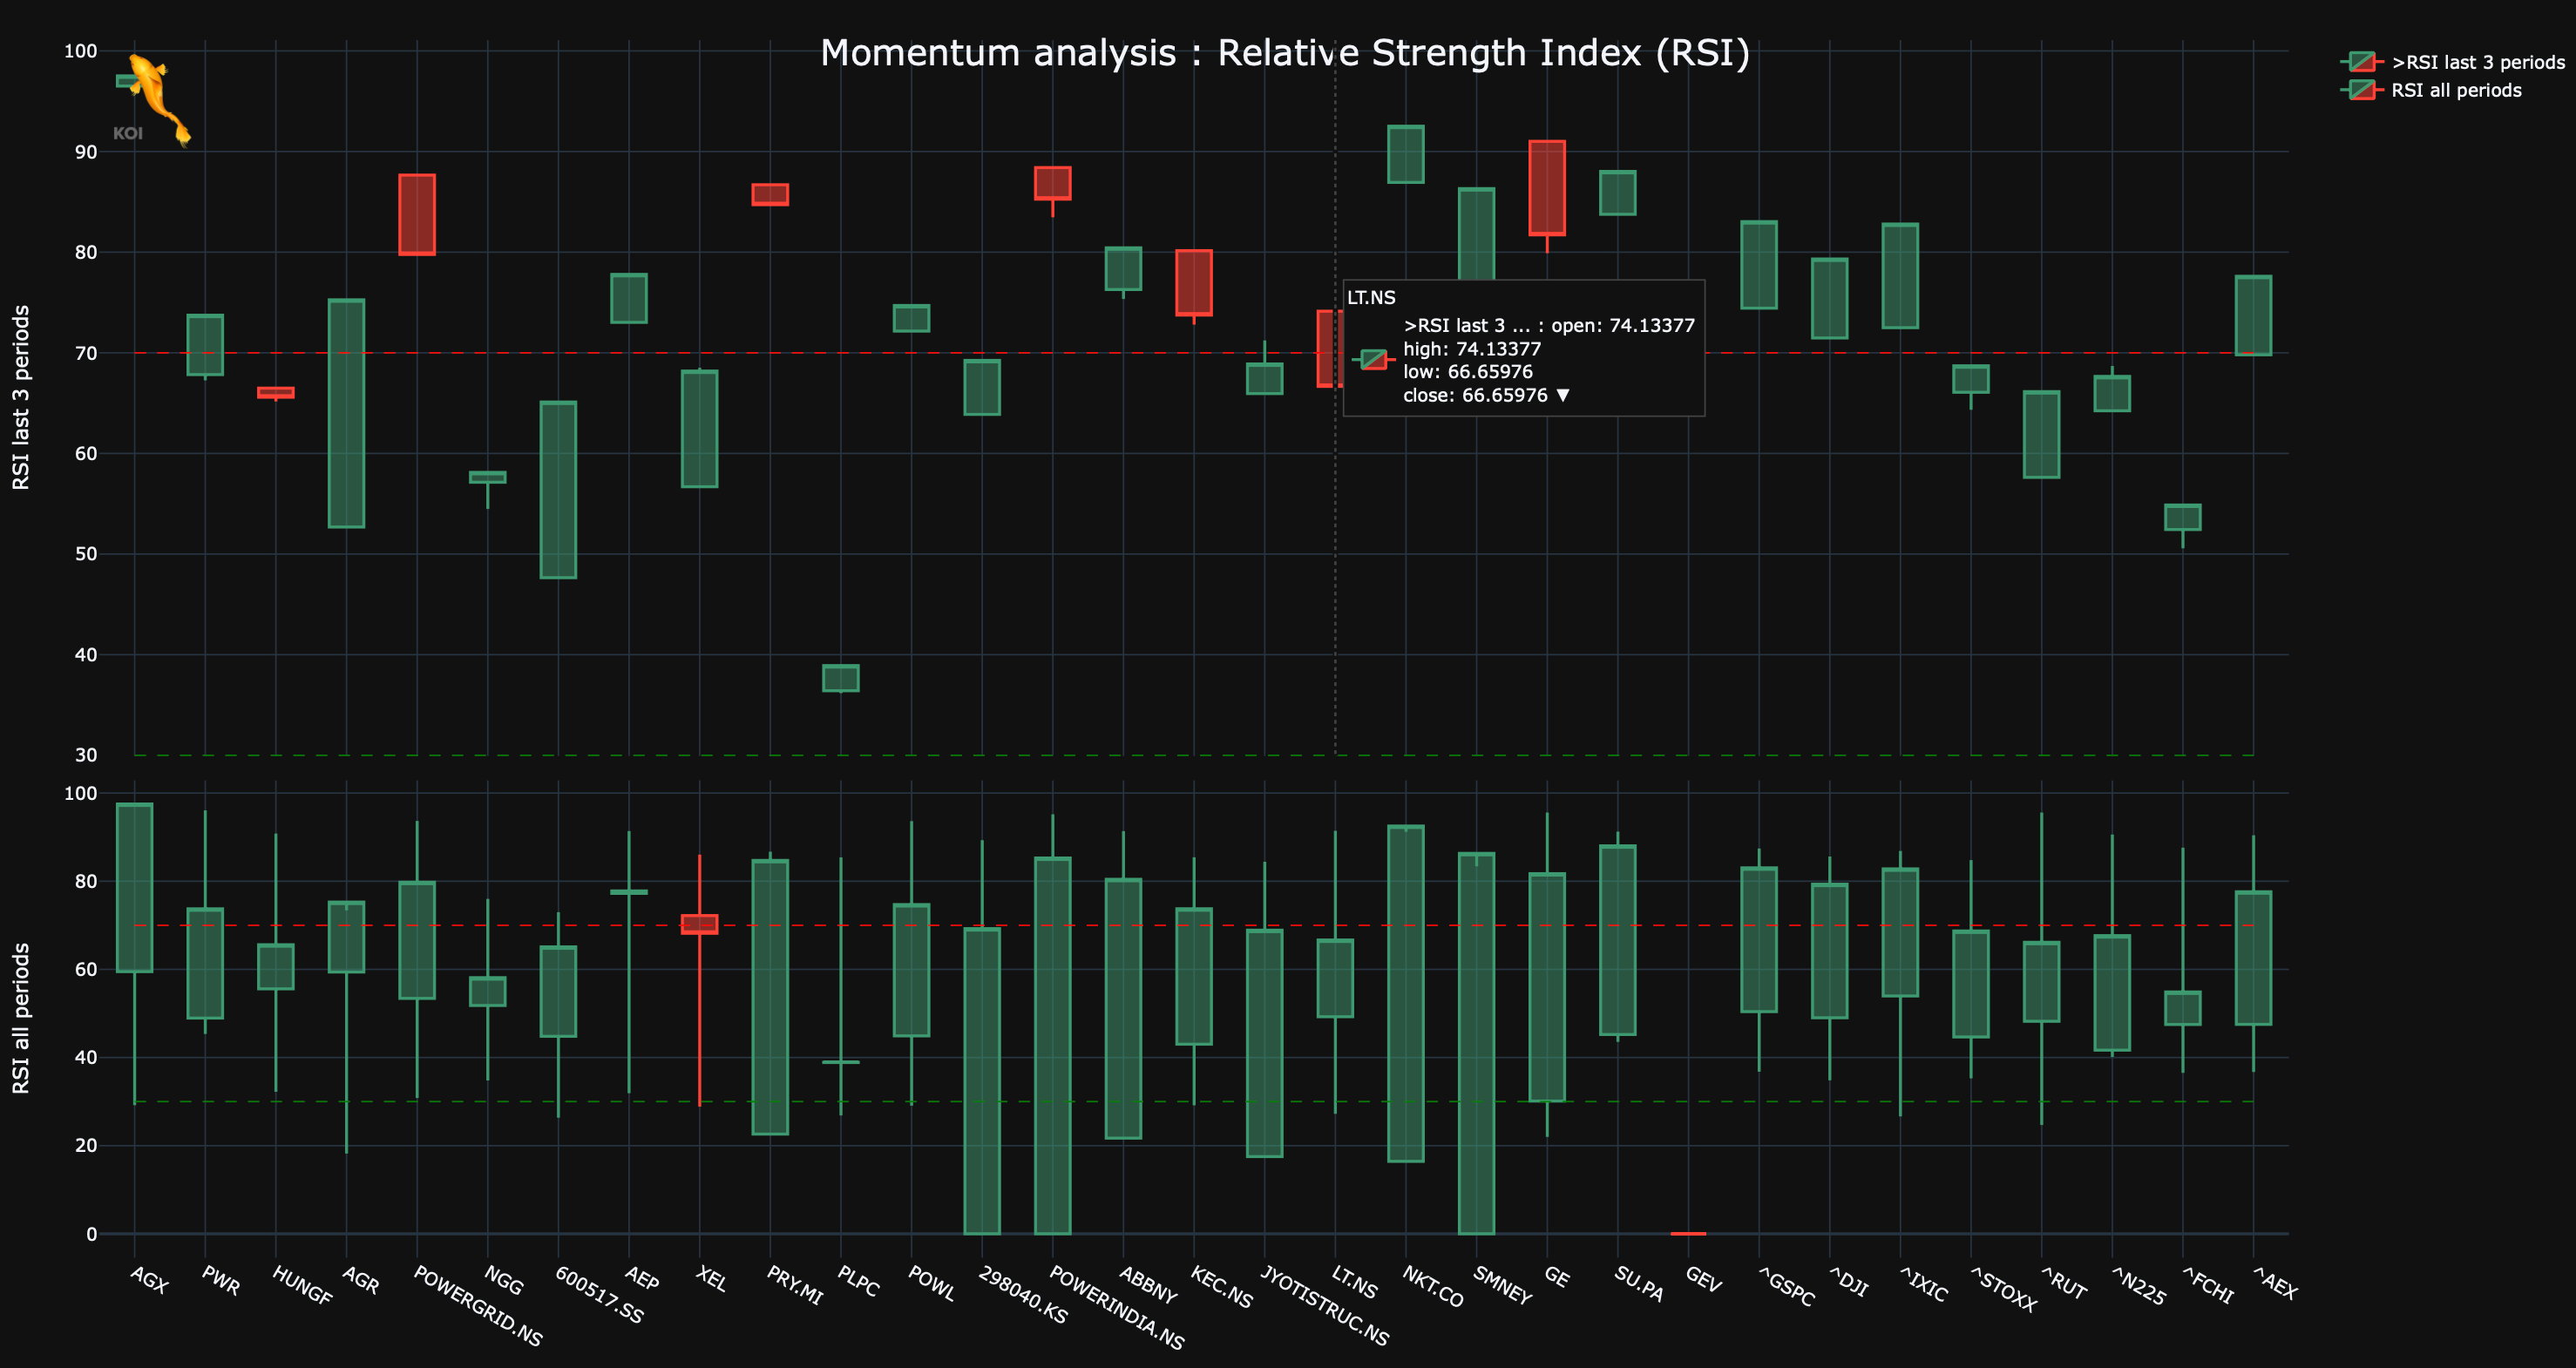
Benchmark RSI indicators for various stocks of a given portfolio
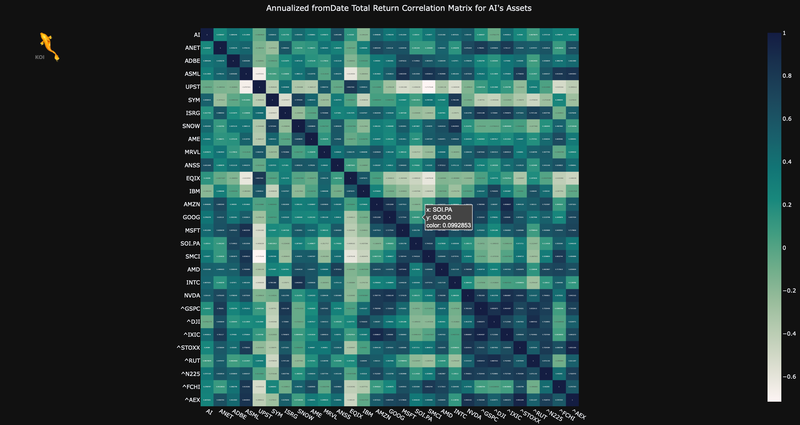
Correlation of returns versus several stocks
Explore KOI
KOI is available on GitHub.
🔗 View the KOI GitHub Repository